Note
Go to the end to download the full example code.
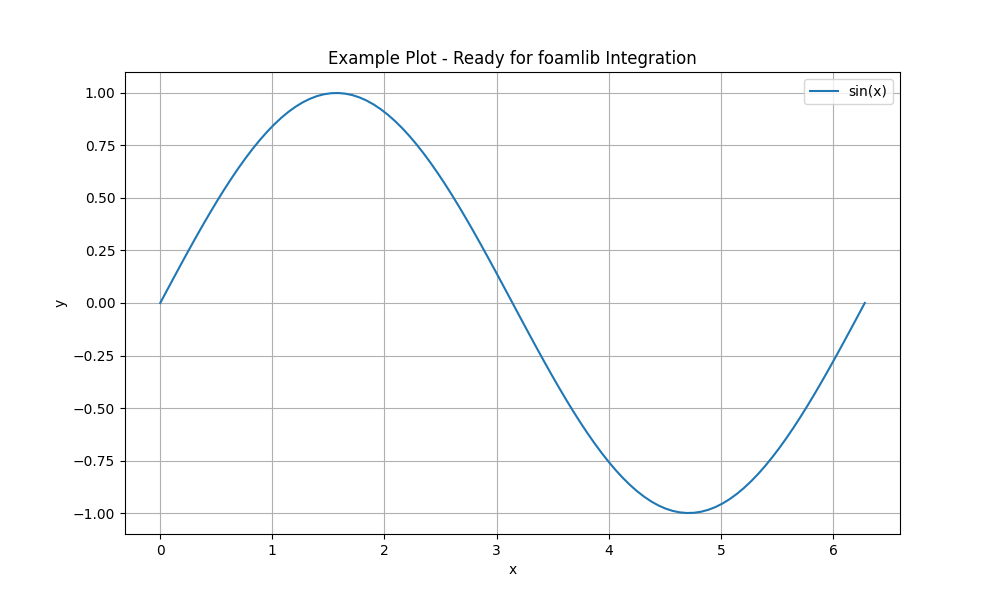
Simple Example Plot.
This is a basic example demonstrating sphinx-gallery functionality. It will be expanded with actual foamlib and OpenFOAM examples.
import matplotlib.pyplot as plt
import numpy as np
Generate sample data
Create some sample data for visualization.
Create the plot
Visualize the data using matplotlib.
plt.figure(figsize=(10, 6))
plt.plot(x, y, label="sin(x)")
plt.xlabel("x")
plt.ylabel("y")
plt.title("Example Plot - Ready for foamlib Integration")
plt.legend()
plt.grid()
plt.show()
Total running time of the script: (0 minutes 0.081 seconds)